Analytics & Visualizations
There are few things as rewarding as showing a client a beautiful dashboard that clearly identifies key trends and metrics essential to their business. However, there are far more things involved than simply the dashboard deliverable. There is the proper warehousing and storage of your data that needs to be optimized for querying purposes. Then follows the exploratory SQL (or query language of choice) with some additional data preparation often in the form of stored procedures, etc. Finally, once your data is clean and ready for consumption comes the actual analytics. Whether it is a data science approach with R or SAS; machine learning via scikit learn, PredictionIO, Tensorflow or AzureML; or Visual Analytics with Tableau or PowerBI, all are tools and technologies that I would be able to leverage to fulfill your analytics needs.
Related Portfolio
Recommended Tools

Tableau
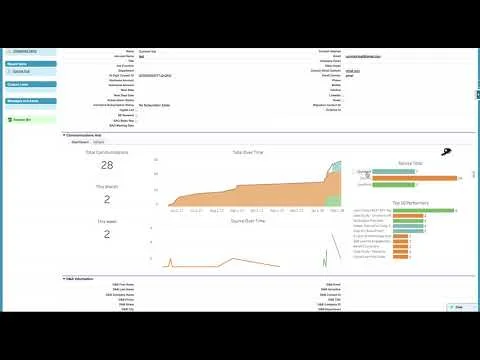
This is my go to tool for enterprise data analytics (e.g. ExxonMobil, Qualtrics and Pluralsight). It is great for interactive dashboards that enable executives and business leaders to easily digest the health of the business as the data seamlessly updates in the background. Tableau also embeds really well into websites or other tools to serve up graphs and dashboards for the end user. I have also done a lot with Tableau Server management in case your organization is brand new to Tableau and need it implemented in order to host the data and dashboards online.

Predictionio
If you are wanting to leverage Machine Learning and haven't the faintest idea on how to get started, I would highly recommend this versatile platform. PredictionIO was acquired by Salesforce and fuels a good majority of their Salesforce Einstein platform capabilities. I have used it as Pluralsight to give recommendations to users on the website resulting in a near 30% lift in forms filled on the website. It is comparatively easy to implement, and can be applied towards a wide variety of use cases.


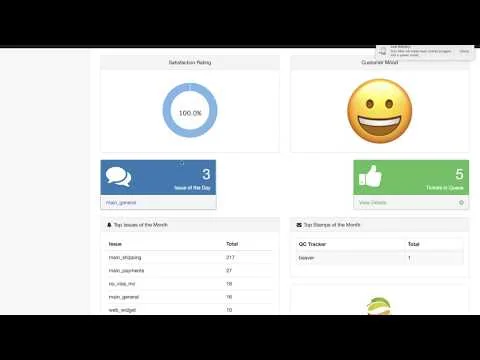
Highcharts/D3
In cases where using a data visualization application is either too costly or bulky to load into your website, open-source javascript libraries such as HighCharts and D3 are great options. These can be either simple or really complex, but in either case are great libraries for embedding analytics into your website.